The Optometrist’s Guide to Investing 101
Chapter 4: How to Quickly Assess a Mutual or Index Fund
5 Steps To Assess a Mutual or Index Fund:
As a budding optometrist starting your first job, you’ll likely access an employer-sponsored 401(k). Glancing at your 401(k)’s mutual fund options might initially feel overwhelming. Here’s a streamlined guide to assessing a mutual fund in under a minute:
(1) Identify funds matching your asset allocation:
I know we have been using Vanguard as our prime example, but many other big brokerage firms like Fidelity will have similar funds with similar names. It is quite common for all 401K plans to have mutual funds like a total stock market index fund, so you need to find something similar.
Example: Fidelity Total Stock Market Index Fund (FSKAX) compared to Vanguard Total Stock Market Index Fund (VTSMX). Both are exactly the same and will have similar cost and return.
(2) Enter the Fund’s Ticker symbol:
We recommend Yahoo Finance. This will allow us to see what type of assets the fund actually invests in, such as Stock vs Bond, Large vs Small cap companies or Foreign vs Domestic bonds/stocks, etc
Example: Vanguard Mid-Cap Index fund with the ticker symbol VO has the majority of its holding in mid-cap US stock.
(3) Select NO-LOAD funds only:
Make sure that there is no additional fee charged (sometime up to 5%) required for you to buy the fund. Usually this fee can be charged prior to purchase (FRONT-Loaded) or after a certain time (BACK-loaded). If you look at the “load option” on any mutual fund on Yahoo Finance. the no-load fund will show "NONE".
(4) Look for the lowest Expense-Ratio (“cost of fund”):
This is probably the most important factor when picking a fund and will cost significant earnings in the long run if too high. Most low-cost, passive index funds will be significantly less than 0.20% (or expense ratio of 20) but many are even as low as 0.05%.
Avoid actively managed mutual funds, since these can have a much higher expense ratio. If you have no other choices on your 401K list, the most cost we would accept is less than 1%.
(5) Past Performance of Earnings:
While past achievements don’t guarantee future outcomes, they offer a glimpse of patterns. Examine first, third, and tenth-year performances for a holistic view.
Example: As of 2023, the Vanguard Total Stock Market Index (VTI) performed at:
- One year = 12.59 %
- Three years = 13 %
- Ten years = 12.07%
Refrain from being overly swayed by a 12.59%gain; it’s an exception. An average 8.60%return over a decade offers a more pragmatic long-term projection. As you hone your investment skills, you can delve deeper, but this foundational knowledge suffices for swift fund assessment.
You can definitely dive into the complicated details of each fund as you build your investing knowledge, but this basic knowledge is more than enough to quickly evaluate the fund.
Financial Pearl
"While past performance does NOT indicate future performance of the funds, it does offer us some insight in the pattern of the fund itself"
How to Analyze a Fund + Compare Good vs Bad:
Let’s delve into a comparison between two stocks that track the Total Stock Market. On the surface, they may seem similar in assets, but as we’ll discover, fees and hidden costs can transform one into a less-than-desirable investment option. We’ll look at the following:
Example #1: Vanguard Total Stock Market Index Fund Investor Shares (VTSMX)
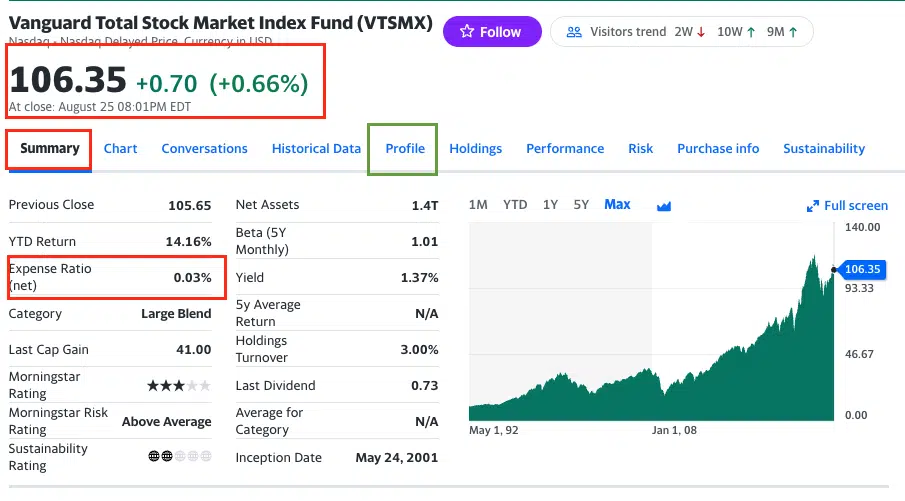
Example: Let say within your 401K, you see Vanguard Total Stock Market Index Fund Investor Shares (VTSMX) and want to know more about this. Using Yahoo Finance.com, you can put the VTSMX ticker in the search bar.
Summary:
- ✅ Current price per share: $106.35 (This isn’t a pivotal metric.)
- ✅ Expense ratio (cost of fund): At a mere 0.03 percent annually, this is notably cheap, a trait of index funds.
Profile:
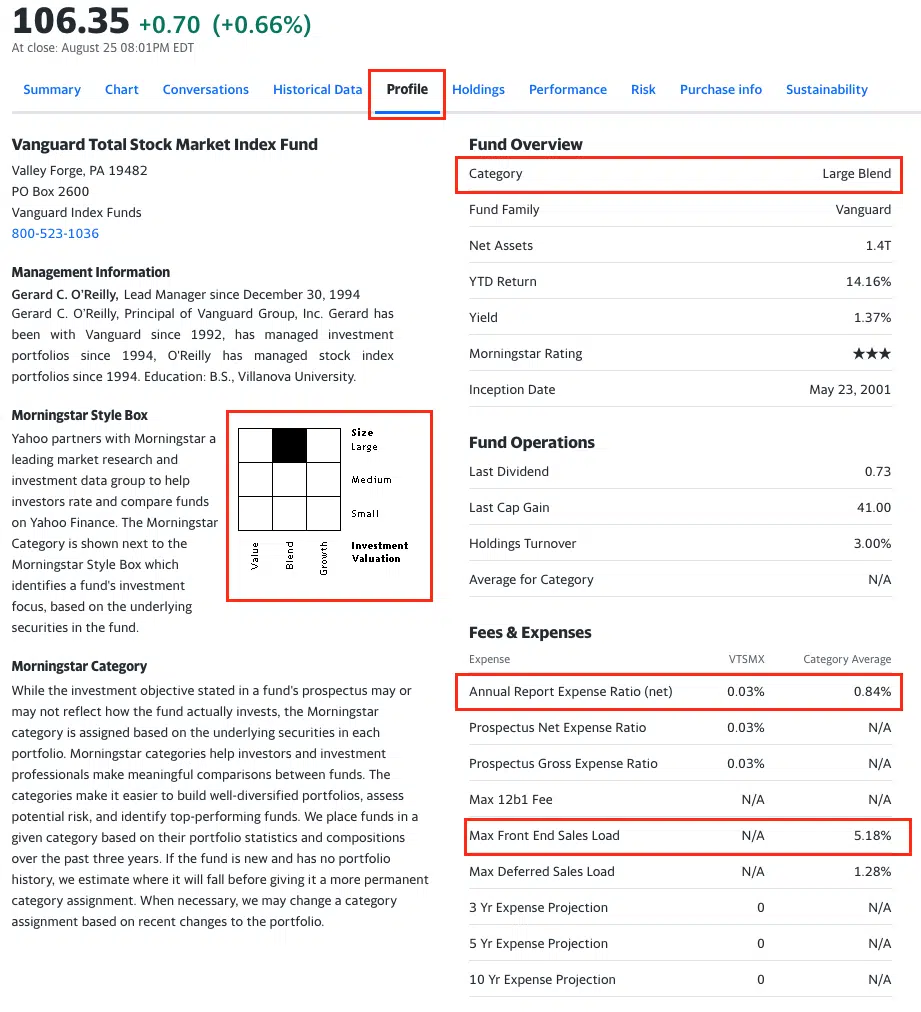
- ✅ Investment valuation box: This fund predominantly channels its investments into “Blended-Large Size Companies.” While it echoes the trajectory of every US company, its allocation is steered by company market cap sizes. Thus, mammoth companies dictate the majority of the index.
- Note: The term “Blended” encapsulates a mix of growth-type stocks (representing companies projected to burgeon at an impressive rate, like Amazon, which, though not currently highly profitable, boasts expansive growth potential) and value-type stocks (representing companies whose stock prices are attractively economical compared to their earnings, such as the relatively steady JPMorgan Chase Bank).
- Note: The term “Blended” encapsulates a mix of growth-type stocks (representing companies projected to burgeon at an impressive rate, like Amazon, which, though not currently highly profitable, boasts expansive growth potential) and value-type stocks (representing companies whose stock prices are attractively economical compared to their earnings, such as the relatively steady JPMorgan Chase Bank).
- ✅ Fees & expenses: Ensure there’s no front or back sales load; in this case, there isn’t.
- ✅ Performance (as of 8/2023):
- Year to date (YTD): 14.16%
- Over three years: 13.0%
- Over ten years: 12.7%
Overall Impression:
VTSMX emerges as an attractive, pocket-friendly index fund boasting robust average returns. Vanguard’s reputation is anchored in offering both economical and high-performing options.
Example #2: Invesco Oppenheimer Main Street Fund Class A (MSIGX)
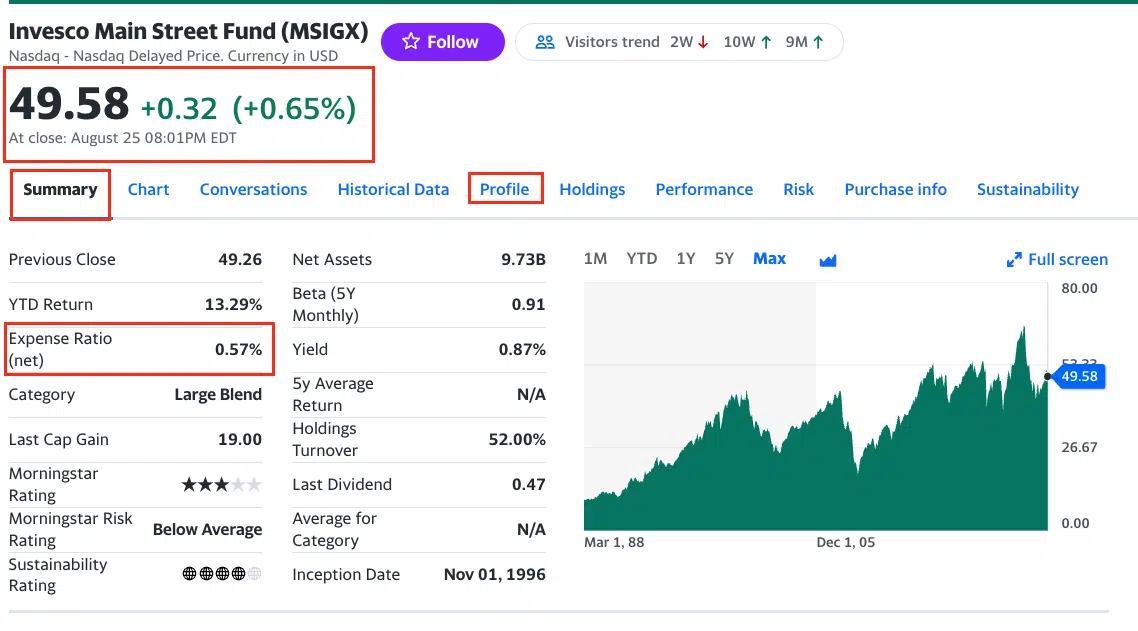
Let’s dive into MSIGX, another mutual fund you might encounter in your 401(k). While it also tracks all US companies, akin to the Vanguard Total Stock Market Index, a deeper look reveals some concerning costs. Navigate to Yahoo Finance and input the MSIGX ticker for a detailed overview.
Summary:
- Current price per share: $49.58 (Again, this metric isn’t important)
- Expense ratio (cost of fund): 0.57 percent annually. In comparison to its counterparts, this is relatively expensive
Profile:
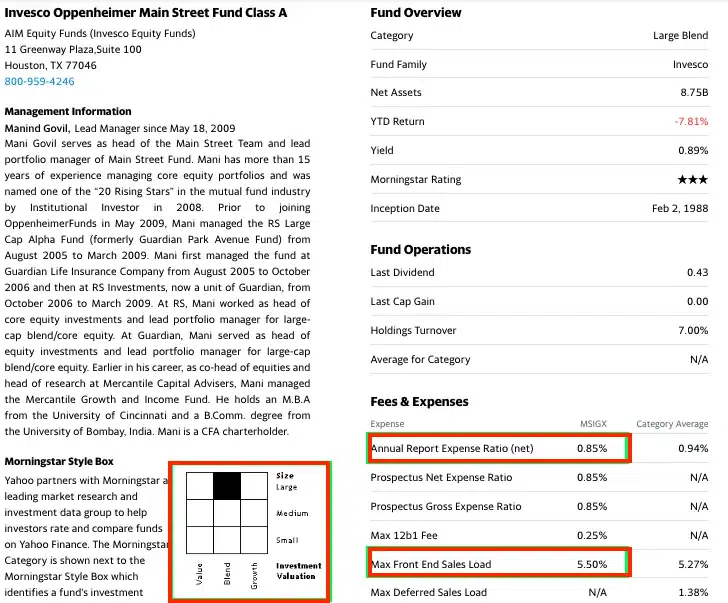
- Investment valuation box: The fund predominantly channels its investments into “Large Size Companies,” mirroring the direction we saw with the Vanguard Total Stock Market Index.
- Fees & expenses: There’s a glaring Front sales load of 5.50 percent. This is a substantial deterrent. To put it in perspective, an investment of $100 immediately incurs a $5.50 charge just to purchase the fund.
- Fees & expenses: There’s a glaring Front sales load of 5.50 percent. This is a substantial deterrent. To put it in perspective, an investment of $100 immediately incurs a $5.50 charge just to purchase the fund.
- Performance (for 2023):
- Year to date (YTD): 13.29%
- Over five years: 8.93 %
Overall Impression:
Regrettably, MSIGX is pretty awful as a broad-market stock fund due to its hidden fees. Its actively managed nature, exorbitant expense ratio, and the audacity to charge an upfront fee of 5.5% make it a hard pass. Consequently, even though it tracks a similar index, its post-fee performance lags behind the Vanguard total stock index fund. A prudent investor would steer clear.
-
Vanguard Total Stock Market (VTSMX)
-
Expense Ratio Cost= 0.03%
-
Investment Valuation= Large Blend
-
Front or Back Load Fee= None
-
10 year Return= 12.70%
-
Invesco Oppenheimer Main Street (MSIGX)
-
Expense Ratio Cost= 0.57%
-
Investment Valuation= Large Blend
-
Front or Back Load Fee= 5.5%
-
10 year Return= 10.42%


